My own plant: from invisible to cited by AI in days.
My company had 5,000-plus product configurations and wind data for every US zip code. None of it was on the website in a form Google, an AI engine, or a customer at 10pm could use. Here's what I changed and what happened.
Full disclosure: this case study is my own company. Not a client. I needed this fixed, couldn't find anyone who did it the way a manufacturer needs it done, and built it myself. Every number on this page comes out of my own ERP and Search Console.
The Problem
Our product data was locked in JavaScript and spreadsheets. The interactive tools on our site (wind speed calculators, product configurators, specification generators) contained genuinely valuable engineering data, but to a search engine the pages were blank. AI answer engines like ChatGPT, Perplexity, and Google AI Overviews had no idea the company existed for informational queries.
Meanwhile, competitors with simpler products but crawlable content were winning organic search across every relevant keyword. And every question a customer couldn't answer on the site became a phone call to my sales team: basic pricing, sizing, compatibility, spec details. The knowledge existed; it just wasn't reachable without a human.
The Approach
I started from the product data, not the website. AI-assisted document analysis structured 5,000+ SKU configurations, engineering ratings tied to all 41,375 US zip codes, and compatibility rules across dozens of product lines. Once the data was structured, the tools and the visibility layer were built from the same source.
The principle: every question customers asked by phone should have a self-service answer, and every answer should be readable by both humans and machines.
What I Built
- Engineering lookup tool: interactive map covering 41,375 US zip codes that turns a customer's location into a code-compliant product recommendation with a PDF report
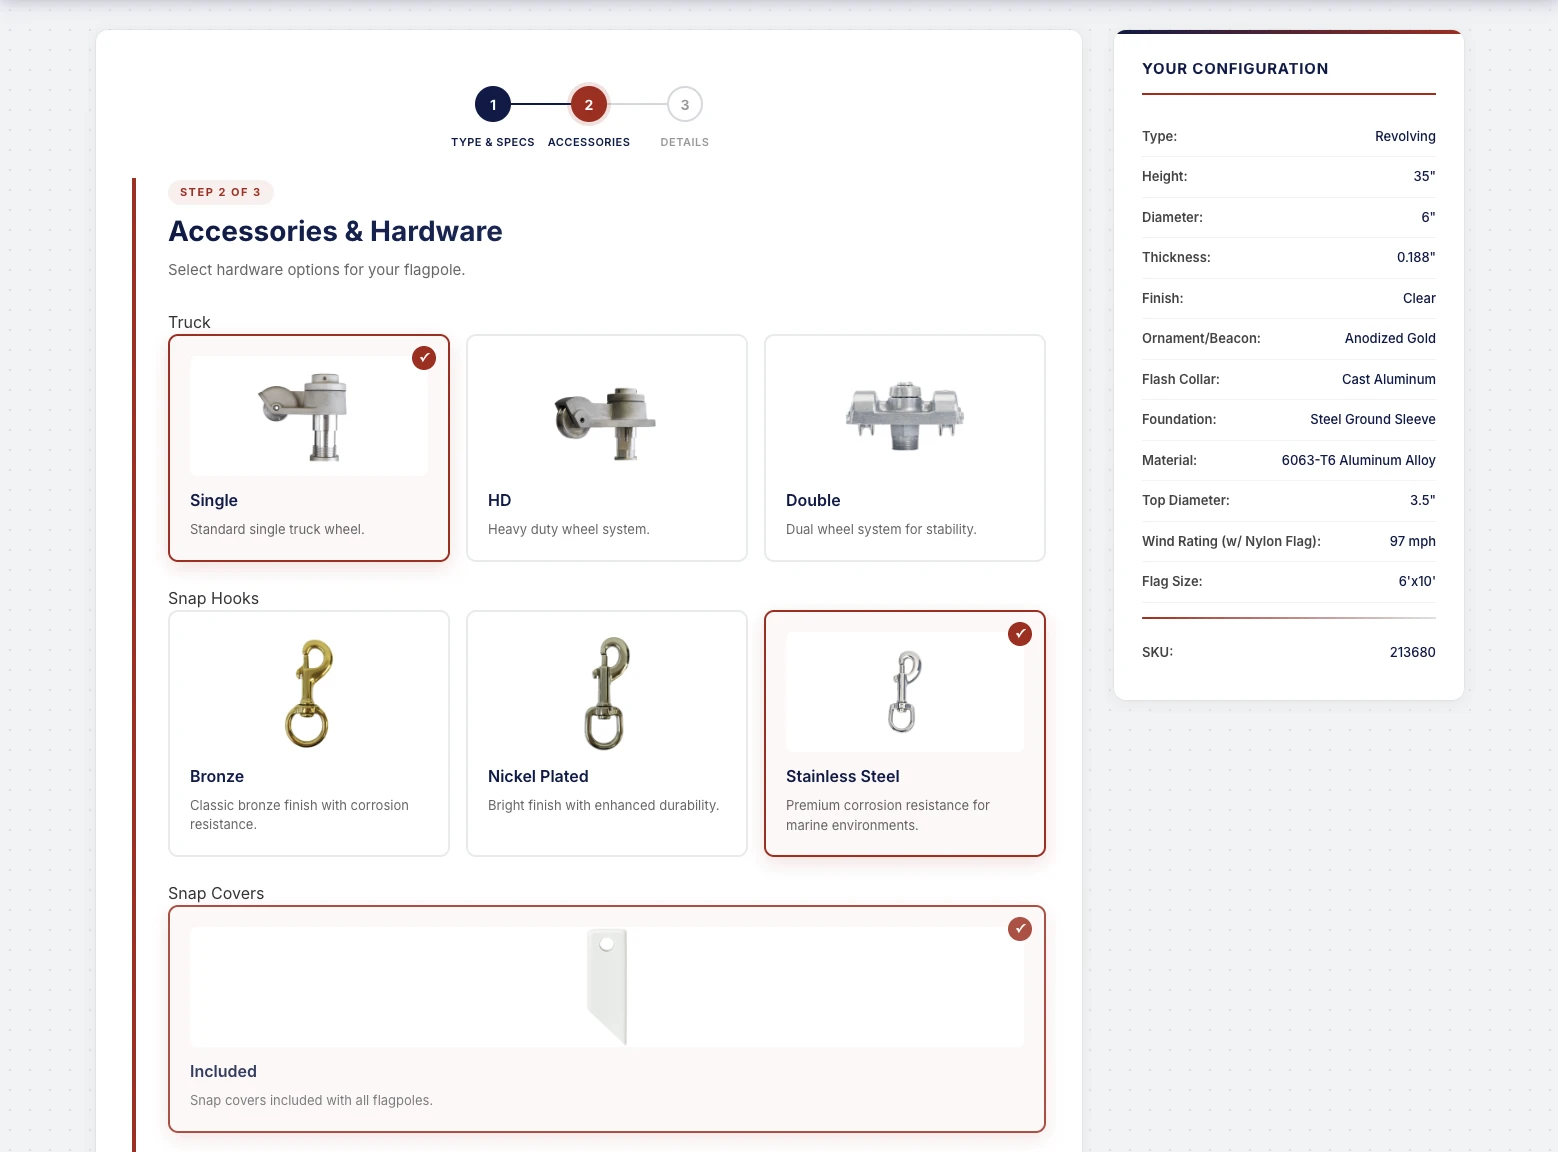
- Product configurator: 3-step wizard covering product type, accessories, and branding with real-time pricing across 5,000+ SKU combinations and branded PDF spec sheet generation
- Specification builder: architect-facing CSI guide spec generator with multi-product support, inline customization, and Word document download
- Selection wizard: 4-question recommendation engine that matches accessory products to the customer's configuration and electrical access
- AI-powered plan analyzer: internal sales tool that parses uploaded construction spec PDFs, extracts requirements, and maps them to product recommendations
- Operations tools: commission calculator, component reorder dashboards, and a bid pipeline manager to take friction out of the internal side too
The Visibility Layer
Building the tools was half the job. The other half was making the data inside them visible to machines. I created static HTML reference content below each tool: rating tables, product specs, engineering references, and FAQ content, all in crawlable, structured format with Schema.org markup that matches the visible content exactly.
Four interconnected tool pages formed a topical cluster, each strengthening the others. No competitor in the industry had anything comparable.
The Results
The engineering lookup page went from unindexed to position 3 for its target keyword within days of deployment. Google's AI Overview began citing the company as a source, pulling specific technical content (industry standard references, rating methodology) directly from the reference blocks.
Customers configure poles, download spec sheets, and request quotes at 10pm without calling. Sales starts every conversation with a finished configuration instead of a list of questions. And when somebody asks ChatGPT about the category, we're in the answer.
The Numbers, a Year In
How I measured: same months, year over year, so the seasonal swing cancels out. Revenue and order data are from the ERP. Search data is from Google Search Console and GA4. I spent more on paid search in 2026 too, so I only count organic here.
| Measure | Window | Change | Source |
|---|---|---|---|
| Net revenue | Jan–Aug 2026 vs. 2025 | +22% | ERP trial balance |
| Flagpole and hardware revenue | Jan–Aug 2026 vs. 2025 | +50% | ERP trial balance |
| Illumination product revenue | Jan–Aug 2026 vs. 2025 | +57% | ERP trial balance |
| Average order value | Jan–Aug 2026 vs. 2025 | +36% | ERP posted invoices |
| Commercial flagpole units | H1 2026 vs. H1 2025 | +89% | ERP item ledger |
| Organic search clicks | Jun–Aug 2026 vs. 2025 | +116% | Search Console |
| Organic search impressions | Jan–Aug 2026 vs. 2025 | +92% | Search Console |
| Average search position (mobile) | Jun–Aug 2026 vs. 2025 | 17.7 → 6.5 | Search Console |
| Visits referred by AI assistants | Jun–Aug 2026 vs. 2025 | 0 → 400+ | GA4 |
Order count fell 11% in the same window while revenue rose 22%. That is the point. Fewer, bigger orders, and sales gets a finished configuration instead of a phone call. The AI assistant number is sessions GA4 attributes to ChatGPT, Perplexity, Copilot and the like, across both of our commercial sites. A year earlier that channel was zero.
What This Means for You
Your products are different. The leaks probably aren't: quotes stuck on missing details, customers who would rather self-serve and can't, and product knowledge Google can't read. The diagnostic finds yours.